Thanks for visiting! As of 3/31/26, we're no longer updating the City Data Explorer. The information and data are still available for reference. For more recent data, please visit the site's Data Sources page.
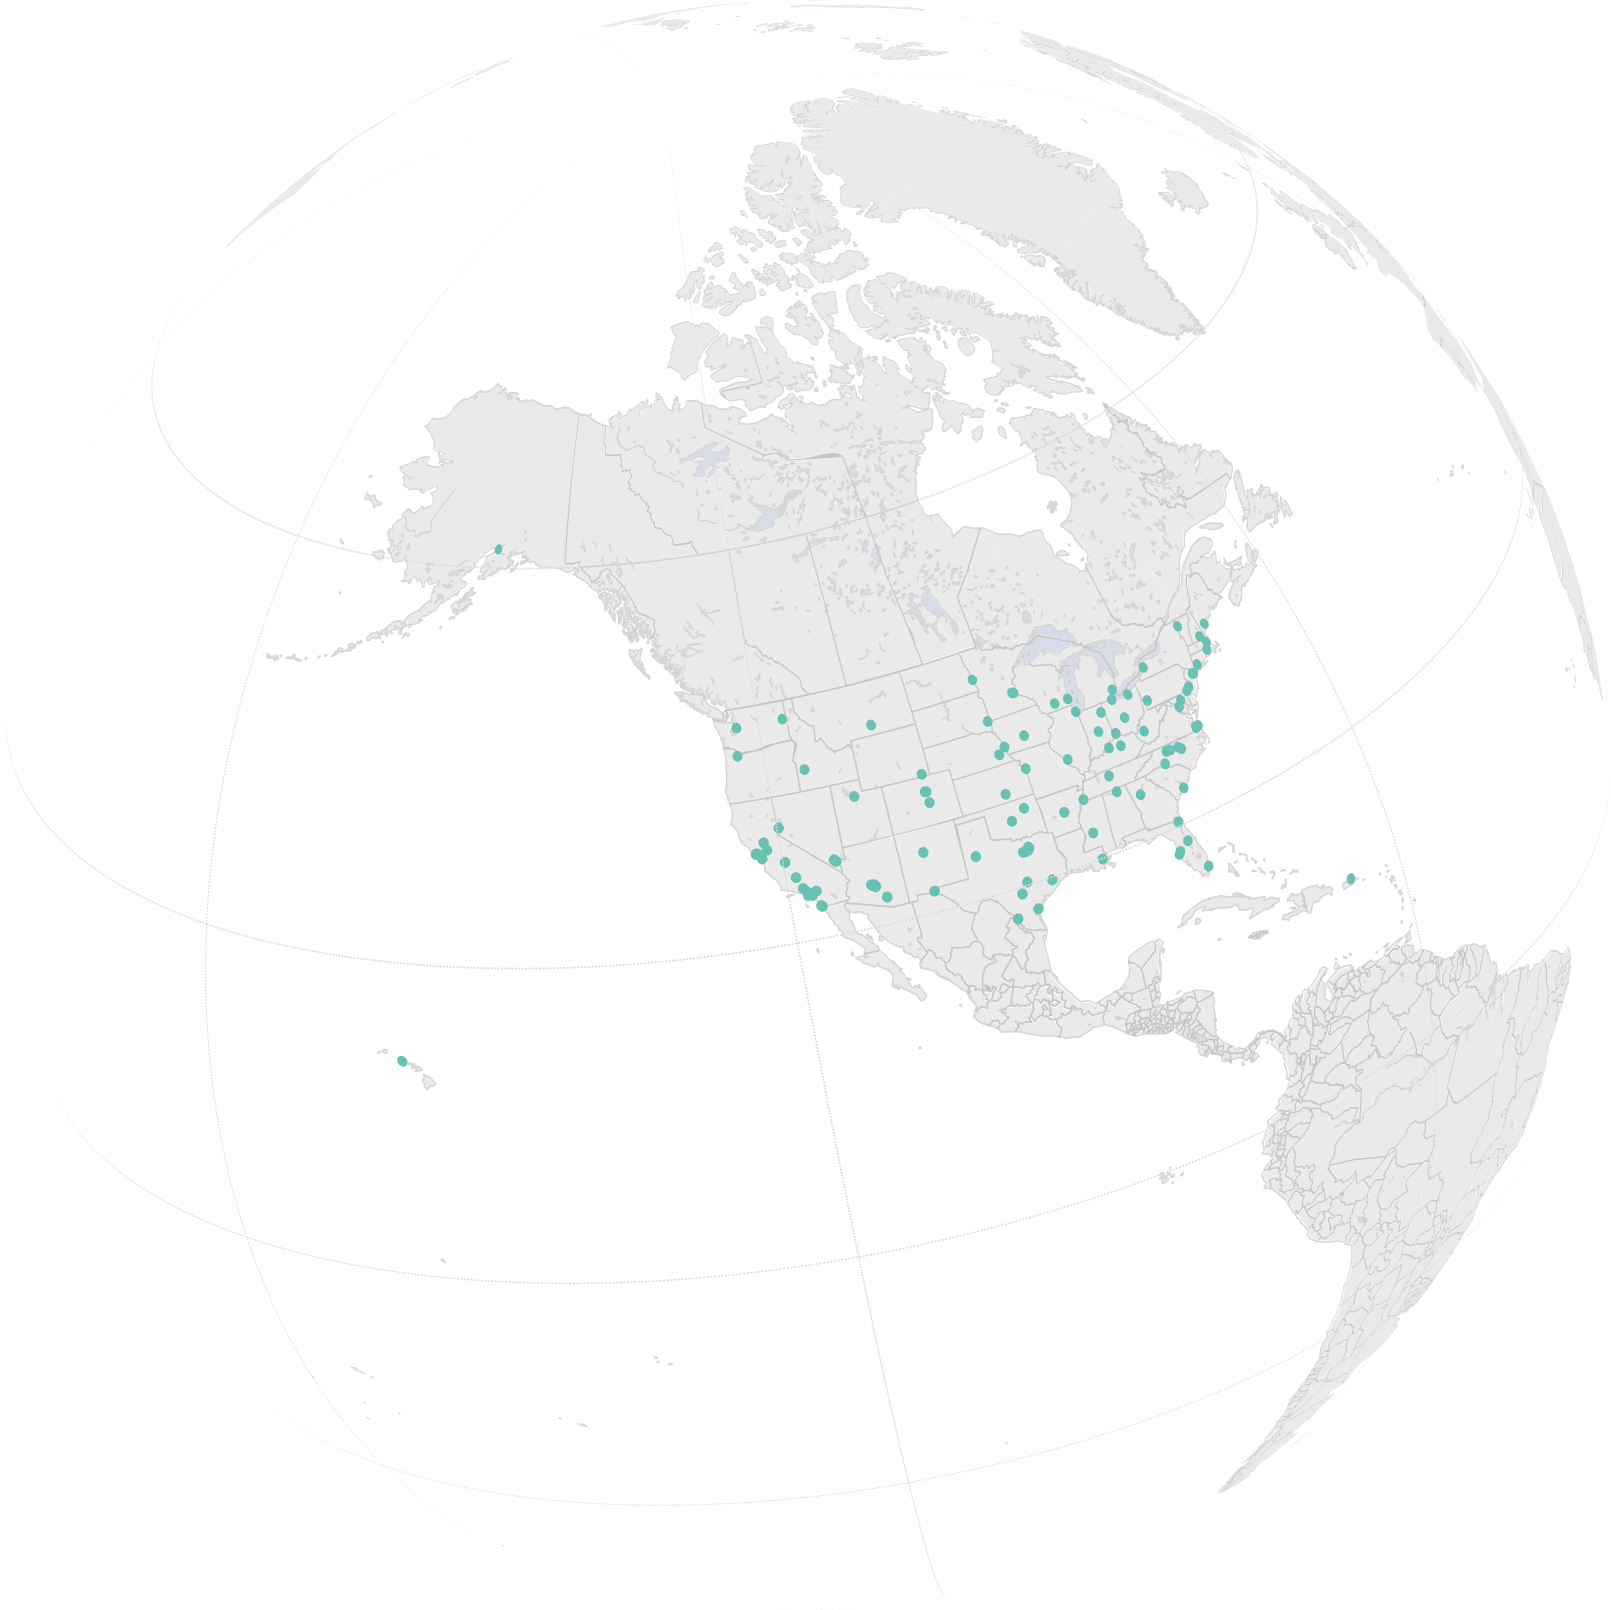
City Data Explorer
Detailed, up-to-date public data for 100+ cities across the United States.
:
Metric Trends Calculated from the Last 5 Years
Improving rapidly
Improving slowly
No change
Worsening slowly
Worsening rapidly